Price action is a trading technique that helps financial market traders improve their trading efficiency. In this method, the Trader can trade using the raw price chart without using any indicators for complex calculations. Price action is an important part of technical analysis. This type of analysis is suitable for traders who base their selection on asset prices. After all, price changes in financial markets such as cryptocurrencies can lead to profit or loss, so correctly predicting digital currency’s price is one of the signs of success. Simply put, price action is a trading technique and market analysis that allows the trader to make decisions using the movement of real prices;
What is price action?
By analyzing price models; Price action tries to give the trader a better way to do things that sometimes seem random in the market. Price action traders are several steps ahead; Their main question is not what is going on; that’s why this is happening! So they can make the right decisions. A trader who uses the price action method is called a price action trader. This group of traders sees everything as simple, which is the most effective way to trade; These traders combine price movements, chart patterns, trading volume, and other market information to enter trades. Of course, this does not mean that it is the best way to analyze the market. Using this technique requires a good understanding of the market so the trader can understand how it moves and its internal order.
The difference between price action and other forms of trading
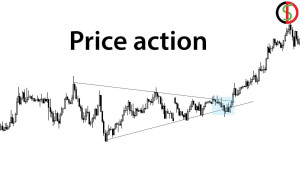
If you look at a price action trader’s price analysis chart, you probably won’t see anything more than a simple chart and key price levels. Almost something like the image below:
On the other hand, most of the time when we look at the analysis charts of many traders and technicians, what we see is a crowded chart filled with various indicators MACD, Stochastic, ADX, Bollinger Band, etc. Something like the image below:
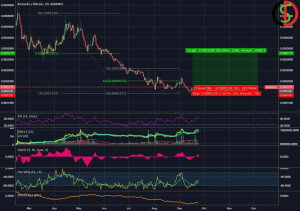
The first negative point about crowded charts is that the indicators take up some of the space at the bottom of the screen, which leaves less room for the price chart. Again, this function is part of the trader’s opinion and guides the information on the non-price side. Therefore, a crowded chart, in addition to covering a smaller area of price, takes the trader’s entire focus away from where it should be, namely the price. If you look at the two chart examples above, you will notice that the price analysis is very simple in the first chart. All the tools and indicators added to the second chart indeed give us more volatility, but all this information is extracted from the original price and none of it can be. helps us understand the market as much as price analysis itself.
Examining some important patterns in price action
Price action patterns, also known as triggers, setups, and signals, are the most important part of entering into a trade. These patterns are very diverse and below we would like to review the 3 most used price action patterns namely Inside Bar, Fakey, and Pin Bar.
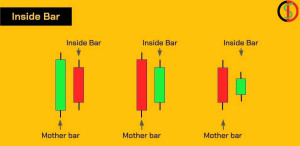
1. inside bar pattern
Inside the bar is one of the 2 types of candles which consists of a large candle on the left side and a small candle on the right side so all the small candles are placed within the range of the large candle. If such a pattern appears in a moving market and at a significant price, There is a high probability that the price will break the current range and make a jump in the direction of the trend. You can see some examples of Inside Bars in the figure below.
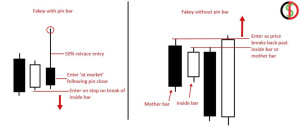
2. Fakey Bar pattern
A fake bar pattern is a failed rebound from the current price range and can be thought of as a failed inside bar pattern. That is, if the value in the inside bar pattern exceeds the previous candlestick but returns to the previous level of the same candlestick, we will have a fakey bar. Observing these patterns will most likely cause the price to move in the opposite direction of the candle shadow, i.e. the same as the main price trend. Please consider the image below.
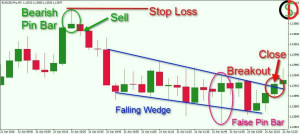
3. pin bar pattern
A PIN bar is a single candlestick pattern and indicates a reversal or retracement of the price at the end of the long shadow of its candlestick. These patterns can be shaped and used in trending and non-trending markets. In a downtrend, after forming a pin bar with a long shadow, the price will likely move in the opposite direction of the shadow of the pin bar to reach the next resistance area. Also, if we are in an uptrend, after forming a Pin Bar, the price may return to the next support area.
What is the price action trading method?
After drawing a range of key support and resistance points as well as key trend lines, price action traders wait for the price to reach a critical range. Then, observing the relevant candlestick pattern, they enter the trade and profit from the market until the price reaches the next level. It is important to pay attention to the fact that just reading an article does not provide the knowledge and experience necessary for professional activity. First of all, we should know that the evolution of prices in financial markets has recurring cycles. That is, if we look at the past charts of a certain asset, we will see patterns that have repeated themselves many times before. These patterns can be considered as a single-price action trading strategy.
This recurring pattern indicates a possible change or continuation of the market trend and serves as a guide for traders to make decisions. The first thing you do in the price action trading method is to remove extra tools and indicators from the chart. For the type of price display, it is better to use candlesticks (price candlestick chart). Next, we need to go to the main limits and draw support and resistance lines on the chart.
final word
Price action is one of the most interesting methods of trading in the financial market, and it tries to predict the next price movement by focusing on important price movements and ranges. Price action is one of the most interesting methods of trading in financial markets such as the cryptocurrency market. In this method, the main focus is on the price range of the asset and its changes, and there is no news about the different types of tools we see in technical analysis. By observing the trend of price changes, it is possible to get a relative idea about the behavior of other traders and market players and consequently the possible trend of price movements in the future.
Price action, like all trading techniques, requires teaching and learning the basics. The purpose of this setup is to identify key market trends, and price patterns, identify trend strength, identify price candles, etc.