Fibonacci levels are one of the most widely used tools in technical analysis of financial markets, including cryptocurrencies. There are many topics or methods, including Fibonacci retracement extension, projection, extension and inversion. Also, many indicators are used in technical analysis, among which the main ones are Moving Averages, Bollinger Bands, Ichimoku Clouds, etc. Fibonacci indicator is one of those popular tools that thousands of traders use in their investments. Therefore, in this article we will talk about this indicator completely. Stay with us.
What is a Fibonacci retracement?
Fibonacci retracement is an important technical analysis tool in cryptocurrency trading that allows you to understand when to execute and close trades or place orders. This indicator uses percentages and horizontal lines to identify important support and resistance points in an uptrend or downtrend. You can use it as part of your cryptocurrency trading strategy. The price of a digital currency does not move in a straight line, but moves up and down, forming a zigzag pattern. For example, in an uptrend, the price does not move directly upwards. It moves up and down before continuing to move up. This pattern occurs continuously in the process.
Many cryptocurrency traders use the Fibonacci retracement method to look for possible places where the price retracement may find support or resistance. A pullback, also known as a price correction, is a temporary price reversal in the trend of the cryptocurrency market. A retracement differs from a retracement in that it is simply a short-term movement against the trend followed by a continuation of the current trend.
How to calculate Fibonacci levels?
These percentages are the same for every Fibonacci indicator you use in different charts, so you don’t need to calculate them manually. However, to understand how this level is calculated, we must start with the Fibonacci series itself. Let’s consider a series of numbers starting from 0 and 1. The next number in this series will be equal to the sum of the previous two numbers. Therefore, the next number after 0 and 1 is equal to the sum of 0 and 1, i.e. 1. At this point, our series is equal to 0, 1, and 1, and similarly, the next number will be equal to the sum of 1 and 1, which is 2. If we continue like this, we will arrive at the Fibonacci series, which has the same starting numbers:
0, 1, 1, 2, 3, 5, 8, 13, 21, 34, 55, 89, 144, 233, 377, 610, 987 و…
If you think a little, you may remember that this series is also taught in our schools. Of course, note that this series is not displayed directly and in the same way on the chart. However, the levels identified in the Fibonacci symbol are derived from this sequence in some way. Except for the first numbers in this list, if you divide each number by the next, you will always get a ratio of 0.618. For example, if we divide 21 by 34, the result is 0.6176. Also, if you divide the number two steps away from us, we always get a ratio of 0.382. For example, if we divide 21 by 55, the answer will be 0.3818. All the levels we see in the Fibonacci indicator (except 50%) are all calculated using this method.
Fibonacci application in cryptocurrency analysis
1. Find support levels
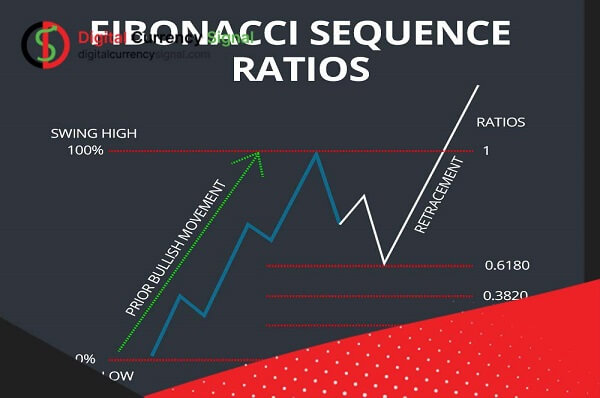
Before using the Fibonacci tool to identify potential support or resistance levels, a trader must first be able to identify “swing high” and “swing low” levels. A swing high is a candle at the top of the trend at any given time, with lower highs directly to the left and right. Conversely, a swing low or candle low is a trend that is lower on both sides.
After identifying these points, select the Fibonacci retracement tool in your trading software to connect swing lows with swing highs. This is where support groups, called maintenance, are created. Each correction is obtained by dividing the vertical distance from trough to peak by the proportions in the Fibonacci sequence.
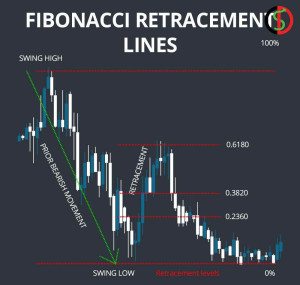
2.Find resistance levels
The process of finding potential resistance levels is pretty much the same as in the previous section, except this time you link the swing high to the swing low. Corrections are again found by dividing the distance from top to bottom using proportions in the Fibonacci sequence.
Trading strategy and using Fibonacci retracement
You can use Fibonacci retracement tools with indicators, such as candlesticks, volatility, volume, moving averages, etc. Some people use it in price action to trade trend changes and counter trend trading strategies. These traders do not wait for prices to reach Fibonacci retracement support or resistance, but rather use Fibonacci levels to determine when their profit is guaranteed. Some people find the Fibonacci retracement confusing and a waste of time and choose not to use it. We used the 61.8% Fibonacci level in all the charts we used as examples. However, the levels used depend on your strategy. It’s up to you to figure out how to use this technical tool to get the best crypto trading results.
Conclusion
One of the tools used in the financial markets is Fibonacci numbers, which are used to analyze the return or continuation of a symbol’s price trend. Fibonacci is a sequence of numbers in which each number in the sequence is the sum of the previous two numbers. Fibonacci levels can be used as important turning points in market trends. Time frames in this method vary from minutes to hours, days and weeks, and traders use different combinations for their purposes. For example, it is used to identify trends or find support and resistance levels.
When you draw Fibonacci levels on your chart, they correspond to the highs and lows of the price chart, these areas are likely to serve as great entry points or exits for trading. Understanding Fibonacci can help beginners better understand market sentiment and improve their knowledge of important aspects such as volatility and trend lines.