Today, with the particular popularity of the financial market and the popularity of the digital currency market, we have seen many enthusiasts enter the field and learn the basics of this market, especially technical analysis. Technical analysis in terms of price charts and other various data such as volumes, trends, supply and demand areas, patterns, and other tools such as indicators; is designed to review and evaluate the price and estimate future price conditions. There are many aspects of technical analysis and one useful and frequently used tool by analysts in this field is the indicator. What are the best cryptocurrency indicators and why should we know about them? Join us to introduce you to the best crypto indicators.
What is an indicator?
Among financial markets and cryptocurrency market activists, indicators are known as the most important technical analysis tools. Financial market analysts are always considering certain indicators as many analysts have successfully used this tool for technical analysis. Indicators or indices are created by combining raw entities on a price chart such as volume, price, and time with mathematical functions and a factor to create auxiliary charts in technical analysis.
In simple terms, by extracting information such as time and price and putting this data into certain activities, results are obtained called Indicators that help researchers in the direction of price analysis. It should always be noted that the priority in technical analysis is always the price chart, and indicators are functions of prices and are used as graphic supports.
Use of indicators in financial markets
As we said, the indicator is a tool in the form of a graph that helps analyze the price behavior of digital currencies. There are different types of indicators and professional analysts choose two to three indicators for themselves even though they have complete mastery over them. It is impossible to say which indicator accurately reflects payment behavior in digital currency. Indicators have different uses in the financial markets. For this purpose, in this part of the article, we try to investigate the use of indicators in the financial market.
- One of the indicators in the financial markets is the warning. Indicators sometimes show trend reversal signals earlier or at the same time, depending on conditions. Therefore, one way to give accurate warnings is to use indicators to change the trend and direction of price movement.
- Predicting the right price to enter the trade is another use of indicators in the financial markets, which has made it used by traders and traders.
- Another use of indicators in financial markets is to confirm the entry and exit of transactions. This method is usually used when analysts based on technical or fundamental data predict the correct direction and price entry in the market and use indicators to confirm.
Best crypto trading indicator
Now that we have covered what trading indicators are, let’s take a look at some of the best indicators for cryptocurrency trading.
1. Relative Strength Indicator (RSI)
It is a momentum (or volatility) indicator created in 1978 by technical analyst Wells Wilder. By calculating and measuring oversold using complex formulas, price movement and the speed and magnitude of price changes can be measured. The different oversold conditions of the RSI formula are between 0 and 100. When it moves below the 30 range, an asset is overvalued. If the value is above 70, the chart enters the overbought territory. In some cases, such as during a sustained trend, This indicator stays in the overbought or oversold territory for a long period. Once placed on the chart, the RSI indicator is characterized by a line moving sideways between two parallel lines.
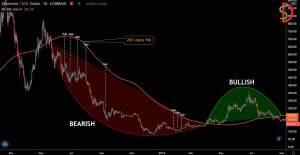
2. moving average (MA)
MA as a reversal indicator is a popular tool used on Bitcoin and other cryptocurrency markets. Its main purpose is to show the average price of a certain number of recent candles. Or in other words, it shows the price action over some time. So, if you are doing a moving average index, you can change the number of times you want to analyze. In this sense, time represents a unit of time-based on the time frame observed by the chart. The moving average indicator you choose as a trader depends on your trading style. For example, traders often use time frames of 20 periods, 50 periods, and 200 periods. With this time frame, traders can determine the overall direction of a digital asset based on selected data over a specific period.
3. Bollinger Bands (BB)
The main idea behind Bollinger Bands is to highlight how the value of a digital asset is dispersed around an average value. BB is defined by a set of trend lines that focus on two standard deviations (negative and positive), This is because prices are moving away from the simple moving average (SMA). Two bands can be used to identify support and resistance levels. Bollinger Bands consist of three main components:
- Upper band (positive) – 20-period standard deviation (x2) + 20-period SMA
- Middle pass – 20-period standard deviation (x2) + 20-period SMA
- The lower (negative) band is the period of the 20 SMA
4. Moving Average Convergence Divergence (MACD) indicator
The MACD indicator is a simple tool that can provide a powerful trading crypto signal. A con refers to two movements moving towards each other, while divergence is when the two main movements are separated by the mean. When the MACD is used, it gives meaning to both trends and price movements. Here, the trend is for a bullish asset to continue to rise (up) and a bearish asset to continue to fall (down). A general rule when using this indicator is to note that the MACD line is moving above zero. This indicates a high position, which means it is a good entry point. But suppose the line goes below zero. In this case, the general direction is down, which means that it is a good time to exit the market.
5. Ichimoku Kinko Hyo
Ichimoku Cloud, also called Ichimoku Kinko Hyo, is an effective visual indicator for cryptocurrency trading. This indicator is a combination of indicators that use support and resistance levels to show the strength and direction of the digital currency market. It should be noted that the Ichimoku cloud is a valuable indicator for day traders Especially with offsite cloud deployments. However, it is recommended to use Ichimoku Cloud with other indicators to confirm trends and reduce cryptocurrency trading risks.
6. Fibonacci Retracement Indicator
Fibonacci retracement levels are popular and useful cryptocurrency trading tools that can help traders identify turning points in cryptocurrency prices. Provides hidden levels in the form of horizontal lines that show when support and resistance levels are expected on a particular price chart. The base levels are 23.6%, 38.2%, 61.8%, and 78.6%. These repair levels are not just random numbers. These correction levels are not just random numbers. Rather, they derive from the Fibonacci sequence, a mathematical method introduced by an Italian mathematician in the 13th century. Most traders in the financial sector use them to analyze price charts to identify potential turning points.
What is the best cryptocurrency indicator?
We have fully described the best cryptocurrency indicators and shared the essential tips for trading them. We may have this question in your mind, which is the best cryptocurrency indicator, and the indicators that are offered by the indicator that can determine the best quality for you in the market? First of all, using too many indicators can cause many challenges in your trading. In many market conditions, the lack of precision required causes indicators to give very wrong signals. This is why you should only use different indicators to confirm positions and execute trades more efficiently. It’s also worth remembering that using some of the best indicators we’ve highlighted at the same time can create good conditions in your trades. Especially in the cryptocurrency futures market, where transactions are made in a short period, the use of indicators with different powers allows you to make better transactions and preserve the losses of this market.