The Trading View website is one of the most reliable and popular platforms for analysis and data analysis in various financial markets, including the digital currency market. As the cryptocurrency market has become one of the most lucrative financial markets in the world, many people around the world have entered it to earn profits and income, and the number of these people is increasing every day. The important thing is that all investors and traders, professional and novice, need a tool to properly analyze the digital currency market.
The technical analysis tools in TradingView are more advanced than similar to other technical analysis platforms like MetaTrader. In this article, we are going to discuss zero to one hundred uses of this analytics platform. Although this platform is provided almost for free, the user can avail of most of its functions and view the analysis of other analysts only by logging into the site. However, to publish personal analyses and communicate with users and other analysts, it is necessary to create a user account on the website itself.
What is the TradingView website?
If you are active in the digital currency market, you should know that all traders need powerful and proper analytical tools to trade, buy and sell digital currencies, earn money in this market, and make successful and profitable transactions. TradingView is a suitable option for both beginners and professionals that offers a variety of charting and trading services and most importantly, it has a free membership. This site makes it easy for people to track digital currency prices in real-time, but the various indicators and tools available on this platform allow people to perform technical analysis for free.
Of course, note that access to the site’s facilities and special tools is not free, and you will need a monthly or annual subscription to take advantage of these facilities. Another interesting feature of Trading View is the ability to share your analysis with other users, so you can improve your skills based on the feedback you receive from others.
What does TradingView do?
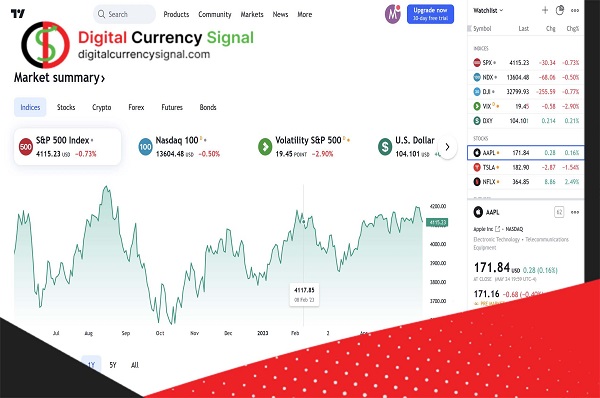
TradingView is a platform that helps you choose technical indicators, create charts and analyze financial instruments. These indicators include patterns, lines, and shapes used by millions of traders every day. TradingView is web-based and does not require downloading any software. Yes, If you want to use the mobile app; You can download the iOS and Android versions. TradingView was launched in 2011 in Westerville, Ohio, and currently boasts a large user base. So that in 2020 alone, more than eight million user accounts were created on this site.
Users can view and analyze price charts of countless stocks, commodities, and digital currencies such as Bitcoin. Users have free and paid options. You can share your analysis and training results and recommendations on the TradingView social network. This way, you can improve your skills with the feedback you get from others.
Benefits of using TradingView
Using each platform and tool has its advantages and disadvantages. Next, we looked at some of the advantages of the Trading View website.
1.Various useful charts
The Trading View site contains various types of most important and useful charts which provide the user with all the necessary information.
2.Valid and reliable data
The trading site processes its data through several research organizations before publishing it. In this way, the information provided by the chart for analysis will be valid and reliable.
3.Reminder message during the transaction
Another important and useful feature of TradingView is to set alerts to remind you of trading time. Thus, traders no longer have to worry about missing the right time to trade.
4.Ability to draw various diagrams
With this feature, draw your table and share it with others for free. On the other hand, users can customize the layout of these charts and make changes if needed. This makes charts specialist and unique tools for each person.
5.Ability to filter according to user needs
With this feature, people can view the chart according to their needs.
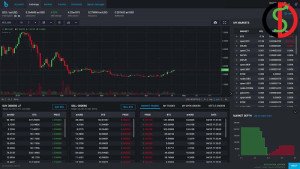
Analysis tools on diagrams and charts
The availability of price charts without the availability of drawing and analysis tools on them is practically useless for traders and analysts. There are more than 90 trading tools available in TradingView to suit all tastes. Here are some of them:
- Draw different lines and areas
- Geometric patterns
- Various types of harmonic and classical patterns
- An explanation of the table
- Types of Fibonacci
- Types of tools for measuring price movements
- Types of time analysis tools and…
How to register on Tradingview
As mentioned earlier, You can easily view the details of each property and item you want without registering and opening a user account. But remember that in this case, you will not be able to access the facilities of this site. Therefore, to use this website better and more efficiently, you should first create a free user account.
To create a free account, go to the main page of the TradingView site and click on the blue (Get Started) option in the upper right corner of the page.
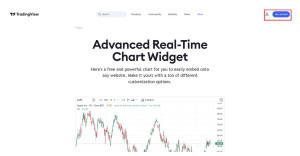
In the next step, if you want to buy an account, choose one of the programs Pro+, Pro, or Premium. Otherwise, go to the bottom of the page and select the “Try Basic Free” option. In this section, you can create an account through any of the methods of registering with Google, Facebook, Twitter, Yahoo, Apple, LinkedIn, or a personal email account, and thus your free Trading View account will be created.
✅Conclusion
In TradingView, users can access cryptocurrency price charts from popular digital currency exchanges, as well as view and analyze US stock price charts, commodities, and various financial indices. There are many standard technical analysis tools such as indicators, classical patterns, harmonic patterns, and Fibonacci levels on this site. The site offers users the possibility to filter information, create new indicators, and communicate with other traders.